


INTRODUCTION
Obstructive sleep apnea (OSA), characterized by frequent sleep fragmentations due to partial or complete obstruction of the upper airway resulting in intermittent hypoxia, is a complex disorder that affects not only one’s quality of sleep but also leaves a lasting impact on one’s quality of life. According to the American Academy of Sleep Medicine, OSA can be diagnosed when a patient presents an apnea-hypopnea index (AHI) ≥5 with associated symptoms or an AHI ≥15 regardless of associated symptoms [1].
OSA is estimated to affect about 3%–7% of men, 2%–5% of women, and these numbers are expected to rise globally owing to an increase in obesity [2,3]. There is a growing health concern for OSA due to its correlation with cardiovascular and metabolic diseases such as hypertension, stroke, and diabetes [4-6]. Evidence suggests that it is also associated with an increased risk of mortality and morbidity due to such diseases [7,8]. Physiological change is not the only negative consequence of OSA that we should be aware of; negative effects on psychiatric health should also be dealt with. Symptoms of OSA include daytime sleepiness, fatigue, and unrefreshing sleep, and these symptoms can often impact one’s quality of life [9]. Evidence from previous studies indicates that nonrestorative sleep and consequent daytime sleepiness are linked with depression or unstable mood [10-13]. When diagnosing OSA, the aforementioned consequences of the disease should also be taken into consideration since it can lead to such serious consequences on one’s physical and mental health.
Unfortunately, due to the heterogeneity of the disorder, no clear subgroups or phenotypes have been established making it difficult to predict prognosis [14]. This is where cluster analysis, which recognizes similar characteristics and groups them, comes in handy [15]. The most notable cluster analysis study done on OSA was the Icelandic Sleep Apnea Cohort (ISAC) that identified three subgroups—disturbed sleep group, minimally symptomatic group, and excessive daytime sleepiness group—using validated sleep-related questionnaires in addition to comorbid conditions [15]. Several other studies from Europe and Asia ensued clustering based on multiple polysomnography (PSG) variables, demographic factors, sleep-related symptoms, comorbidities, and some studies obtained similar results whereas others ended up with different clusters [16-19].
Previous studies, however, have not explored psychiatric or mood symptoms related to OSA in-depth although sleep-related symptoms can markedly impact one’s mood. To assess this aspect of OSA, we aimed not only to identify subgroups of OSA by applying cluster analysis but also attempted to show how mood problems manifest in subgroups of OSA.
METHODS
Subjects
A total of 1,446 participants underwent PSG at Nowon Eulji Medical Center (Seoul, Korea) from January 2003 to November 2012. This retrospective study included adult Korean patients who met the diagnostic criteria of OSA. They also had to fill out the following self-report questionnaires: Epworth Sleepiness Scale (ESS), Korean version of the Pittsburgh Sleep Quality Index (PSQI-K), Horne and Östberg Questionnaire (HOQ), and Korean edition of Profile of Mood States (K-POMS). Those with missing data were excluded from the study, and as a result, this study comprised 346 OSA patients. This study was approved by the Institutional Review Board of Eulji Hospital (Eulji 2017-06-011), and written consent was obtained from all participants.
Polysomnography
All subjects underwent overnight PSG (Medcare-Embla®, A10, S7000; Reykjavík, Iceland) at Nowon Eulji Medical Center. Somnologica (Medcare-Embla®) software program was used for analysis. A trained technician did a preliminary scoring of PSG variables, and then psychiatrists with specialties in sleep medicine confirmed scorings according to the American Academy of Sleep Medicine Scoring Manual. Apneas were defined as an absence of airflow on the oronasal thermistor or nasal pressure cannula for ≥10 sec. Hypopneas were defined as a ≥30% reduction from baseline in airflow for ≥10 sec associated with at least 3% oxygen desaturation. The AHI was calculated as the mean number of apneas and hypopneas per hour of sleep [1]. The following were also obtained in PSG: respiratory disturbance index (RDI), oxygen desaturation index (ODI), sleep efficiency, respiratory effort-related arousal (RERA), mean oxygen saturation, lowest oxygen saturation, time percentage of <90% saturation, average desaturation percentage. According to the third edition of the International Classification of Sleep Disorders, RDI is defined as the sum of apneas, hypopneas, RERAs divided by total sleep time [20]. RDI ≥5 per hour of sleep coupled with associated symptoms, medical, or psychiatric disorders are required for a diagnosis of OSA. Individuals with an RDI ≥15 regardless of associated symptoms can be also diagnosed as having OSA [20].
Symptom questionnaire
To better understand subjective sleep quality and sleep-related symptoms, it was important to utilize valid self-report instruments. ESS, PSQI-K, HOQ, and K-POMS were used as self-report questionnaires.
The ESS is a widely known scale that assesses daytime sleepiness. It measures eight items that can range from 0 to 3, making the total score from 0 to 24. The higher the score, the more likely one suffers from daytime sleepiness [21]. The interpretations of the ESS scores are as follows: 0–10, normal daytime sleepiness; 11–24, excessive daytime sleepiness [21]. We used the Korean version of ESS which was validated for reliability by Cho et al. [22].
The PSQI-K is comprised of nine questions that evaluate overall sleep habits in the past month [23]. Specific components are as follows: sleep quality, sleep latency, sleep duration, habitual sleep efficiency, sleep disturbances, use of sleep medication, and daytime dysfunction. Each component can range from 0 to 3, and the total score ranges from 0 to 21. The higher the score, the worse one’s sleep quality is. The PSQI cutoff point for poor sleepers is 5 or above [24], but according to Sohn et al. [23], 8.5 has been suggested for the best cutoff point for PSQI-K.
The HOQ analyzes one’s morningness or eveningness with 19 questions with scores ranging from 16 to 86. Scores of 41 and below indicate “evening types”, scores of 59 and above indicate “morning types,” scores between 42 and 58 indicate “intermediate types” [25].
The K-POMS, unlike other depression scales, is a test that measures the entirety of mood by measuring six traits: tension, depression, anger, vigor, fatigue, and confusion. The K-POMS total score, also known as total mood disturbances, is calculated according to the following equation: (Tension+Depression+Anger+Fatigue+Confusion) - Vigor [26].
Statistical analysis
The cluster analysis was performed using K-means cluster analysis. For numerical variables, the results were expressed as the mean value±standard deviation, and for nominal variables, the results were expressed as percentages. Intergroup differences between clusters were evaluated using one-way ANOVA and post hoc Bonferroni analysis. A value of p<0.05 was defined as statistically significant. All statistical analyses were performed using SPSS ver. 22 (IBM Corp., Armonk, NY, USA).
RESULTS
Demographics
A total of 346 patients were analyzed, and this study mainly consisted of middle-aged men with severe OSA. The mean age was 47.07±13.00 years, and the mean AHI was 37.78±24.05. The average BMI was 25.96±3.87, and the average ESS score was 8.94±5.04. They were mostly intermediate types in terms of morningness or eveningness with the HOQ of 52.23±9.73. The average K-POMS total score was 25.60±35.52. The general characteristics of this study’s population are displayed in Table 1.
Cluster analyses
A total of 11 PSG variables were taken into consideration along with BMI, age, and results of self-report questionnaires mentioned above. Cluster analyses resulted in three distinct subgroups in our study population as presented in Table 2. Age, hypopnea index, and sleep efficiency were not statistically significant. The scores of the HOQ indicate that all patients were intermediate types.
Cluster 1, with 166 patients, turned out to be the largest cluster among the three clusters (47.98%) and similar to other clusters, was predominantly male (n=124). The mean ESS score was 8.06±4.90, and the mean PSQI-K score was 7.27±4.15. This group had the lowest K-POMS total score (7.99±18.59) and the lowest AHI (24.81±13.06). PSG indices such as RDI, ODI, saturation values were the least severe when compared to other clusters. Thus, this cluster was labeled as the “moderately symptomatic OSA with the least disturbed mood group.”
Cluster 2 (n=90, 26.01%) corresponded to severe symptoms of OSA (AHI 68.35±16.13) with excessive daytime sleepiness (ESS, 10.14±4.44). Several PSG indices showed that patients who belonged to this group had the worst breathing and saturation parameters. The mean RDI was 68.51±16.05. The average desaturation percentage was 10.13±3.40. It should be noted that cluster 2 had the highest BMI (27.85±4.21) perhaps accounting for the severity of OSA parameters. Although patients in this cluster complained of daytime sleepiness, their K-POMS total scores do not indicate disturbed mood (9.39±21.05). This group was labeled as the “severely symptomatic OSA not so disturbed mood group.”
Cluster 3 was the same size as cluster 2 (n=90, 26.01%) but had more female population (cluster 2, n=9 vs. cluster 3, n=18). Although the ESS scores (9.34±5.59) were in between those of clusters 1 and 2, patients in this cluster had the highest K-POMS total scores (74.27±23.84) and complained of poor sleep quality (PSQI-K 10.46±4.33). When analyzing subscales of the K-POMS total scores, cluster 3 patients showed mood disturbances in all six traits compared to patients who belonged to other groups. The mean AHI was 31.14±19.02. The mean ODI was 22.38±15.82, and the mean RDI was 32.01±18.60. When compared to cluster 2, all PSG variables indices were better in quality for cluster 3. The final cluster was labeled as the “moderately symptomatic with highest disturbed mood group.”
DISCUSSION
Currently, when classifying OSA, only the AHI index is taken into consideration, and there has been a large amount of evidence that supports the index alone is not enough to understand the complex and heterogeneous nature of the disorder. The ISAC study was the first to perform cluster analysis on its study population in an attempt to identify subgroups of OSA. Several other studies tested the generalizability and replicability of the findings in the ISAC study to establish universally applicable subgroups. Although some subgroups looked promising, it is still an ongoing process. This study was also developed to integrate various aspects of the disorder, particularly focusing on the psychiatric outcomes of OSA. After incorporating OSA severity, symptoms related to sleep, mood states, and several PSG variables, this study identified three clusters for 346 OSA patients.
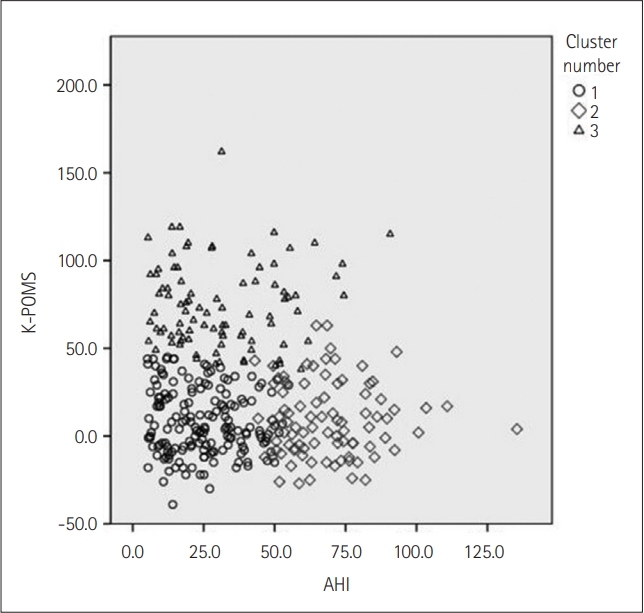
Cluster 1, the moderately symptomatic OSA with the least disturbed mood group, in general had the lowest average ESS, PSQI-K, K-POMS total scores, AHI, RDI, ODI, RERA, and saturation indices compared to clusters 2 and 3. These numbers are especially substantial when compared to cluster 2, the severely symptomatic OSA not so disturbed mood group. As represented in Figure 1, clusters 1 and 2 are distinctive from each other when considering K-POMS total scores and AHI. The different characteristics of clusters 1 and 2 are also evident in post hoc analysis; cluster 2 was significantly different from cluster 1 in ESS, BMI, AHI, RDI, ODI, RERA, and all saturation indices. These parameters are related to the severity of OSA symptoms and thus explains excessive daytime sleepiness patients in cluster 2 complain. However, despite these differences, K-POMS total scores between clusters 1 and 2 are not significantly different from each other after post hoc analysis. A similar result was obtained when comparing PSQI-K scores.
Cluster 3, the moderately symptomatic with highest disturbed mood group, compared to cluster 1 had higher average ESS, PSQI-K, K-POMS total scores, BMI, AHI, RDI, ODI, RERA, mean oxygen saturation, lowest oxygen saturation, time percentage of <90% saturation, average desaturation percentage. However, after post hoc analysis, there was no significant difference between most values except for PSQI-K, K-POMS total scores, RDI, ODI, mean oxygen saturation. Although clusters 1 and 3 display similar profiles, patients in cluster 3 experienced poorer sleep quality and presented more mood disturbances.
When comparing cluster 2 with 3, despite having less severe AHI and saturation indices, patients in cluster 3 scored worse PSQI-K and K-POMS total scores compared to patients in cluster 2. The lack of correlation between one’s subjective feeling of poor sleep quality and objective values such as PSG values implies that patients in cluster 3 are experiencing subjective-objective sleep discrepancy, a common finding in insomnia disorders [27]. There was no significant difference between each cluster in terms of sleep efficiency: cluster 1, mean 82.57%±13.17%; cluster 2, mean 85.02%± 8.65%; and cluster 3, mean 82.09%±15.03%. However, individuals in cluster 3 seem more vulnerable to poor sleep quality and display the highest K-POMS total scores, POMS-T (tension), POMS-D (depression), POMS-A (anger), POMS-F (fatigue), and POMS-C (confusion) scores, along with the lowest POMS-V (vigor). Whether poor sleep quality contributes to poor mood states, or it is the poor mood states that contributes to poor sleep quality could not be distinguished in this study and leaves room for future studies.
Our study has demonstrated the even with similar or better PSG profiles do not always correlate with lesser fatigue or better mood in the population OSA. Considering the heterogeneity of the disorder this result does not come as a surprise and once again recognizes the need to better understand the disorder. In the psychiatric context, sleep not only has been associated with the ability to carry out daytime activities but also with depression and numerous psychiatric disorders. One can experience fatigue as a symptom of depression or as a result of being tired, and it is often hard to differentiate the cause. In our study, fatigue and depression were separately measured, and it showed that individuals who had the highest mood disturbances measured by K-POMS also exhibited the highest POMS-D and POMS-F. The study also showed that these individuals’ ESS scores, which measured daytime sleepiness, were not associated with K-POMS total scores.
Strengths and limitations
To the best of our knowledge, this was the first study to include mood states in cluster analysis of OSA. Our study not only attempted to cluster OSA according to previously utilized parameters but also focused on psychiatric outcomes related to OSA. Our study showed that there is a certain population within OSA patients who are more affected psychiatrically. They exhibited significantly higher mood disturbances as demonstrated in K-POMS total scores and its six components. Previous studies have shown a higher prevalence of depression in OSA patients compared with the general population [28]. Other studies have suggested depression as a risk factor for coronary artery disease [29]. Thus, higher mood disturbance combined with OSA is likely to contribute to an increase in morbidity and mortality of OSA. Our study’s results suggest when evaluating the severity of OSA, psychiatric presentations, such as mood disturbance, should also be taken into consideration, along with the conventional parameters such as AHI and ODI. We also suggest that in future studies, the validity and efficacy of treatment for disturbed mood along with treatment for OSA to be explored in a psychiatrically vulnerable population of OSA patients.
The study has several limitations. First, this study was a singlecenter study that comprised of Korean patients and therefore not ethnically diverse. Some characteristics of OSA, such as craniofacial profile or BMI, are different between the Asian population and the non-Asian population, and the generalizability of this study might not extend to the non-Asian population [30]. Second, the accessibility of PSG may have caused selection bias. Before 2018, PSG was not covered by the national health insurance system in Korea, and there is a chance that individuals with mild OSA symptoms were less likely to get tested than those with severe OSA symptoms. Lastly, PSG only gathers data from a single night whereas the ESS, PSQI-K, HOQ, and K-POMS total scores are representations of a longer period. This leaves room for discrepancies between PSG indices and the self-report scales, and thus, future studies should consider follow-up PSG.
Conclusion
Our study showed three distinct clusters: the moderately symptomatic OSA with the least disturbed mood group, the severely symptomatic OSA not so disturbed mood group, and the moderately symptomatic OSA with highest disturbed mood group. Comparison between clusters indicated that there are individuals who are more likely to complain about disturbed mood states among OSA patients. Since OSA can have a serious impact on one’s quality of life, mood states and its psychiatric outcomes should also be important factors when diagnosing the disorder.