Relationship Between Biological Rhythm and Food Addiction in Obesity
Article information

Abstract
Objective
Obesity is a common, multifactorial, and epigenetic disease. Emotional eating and food addiction are common eating behaviors in obese people. Biological rhythm helps the body adapt to the light-dark cycle and relates to eating behavior, including obesity. Thus, the study aims to reveal whether food addiction, an important factor in obesity, is affected by biological rhythm.
Methods
A total of 130 participants (obese=76, nonobese=54) participated in the study. All participant’s anthropometrics were recorded. Beck Depression and Anxiety Inventories (BDI and BAI) were obtained. Afterward, the Yale Food Addiction Scale (YFAS) form was filled out to evaluate food addiction. Finally, they were asked to fill in the Biological Rhythms Interview of Assessment in Neuropsychiatry (BRIAN) form to assess biological rhythm.
Results
Obese and nonobese subjects had a significant positive correlation with body mass index (BMI), fat mass, fat-free mass, body fat percentage, and YFAS between weight (p<0.001). BRIAN chronotype score and BMI were negatively correlated between obese subjects (p<0.05) but not in nonobese subjects. BDI and BAI were significantly positively correlated (p<0.05, p<0.001) with BRIAN subscales except for chronotype in obese patients. Thus, higher scores in BRIAN imply greater disturbances in biological rhythms. YFAS results were positively correlated with weight, BDI, BAI, and BRIAN subtype parameters in the obese group. In the nonobese group, there was a positive correlation between YFAS and BDI and no correlation between the YFAS and BRIAN subtype parameters.
Conclusion
As a result, if the person is both obese and has been diagnosed with food addiction, obesity may have emerged as a continuation of depression, anxiety, and biological rhythm disruptions.
INTRODUCTION
Obesity is a common, multifactorial, epigenetic disease that significantly threatens human health worldwide [1]. The increase in adipose tissue in obesity is associated with the disruption of energy balance, and energy must be taken from food [2]. However, since the mechanisms for energy intake vary individually, the reasons for variabilities gain importance. Eating factors especially gain importance in the evaluation of body weight. To date, emotional eating and food addiction have been shown as common eating behaviors in obese people [3].
Food addiction is defined as a behavior characterized by compulsive overeating of foods, which activate the dopaminergic reward circuit of the brain, and thus the individual seeks pleasure [4]. Eating is a rewarding behavior. The taste and consumption of delicious food activates the reward system in the brain [5]. The neuronal circuits of homeostatic feeding and reward behavior are highly integrated and interdependently regulate feeding behavior [6]. Food addiction is associated with low self-esteem, psychological stress, low quality of life, and depressive symptoms [7]. Previous studies have shown that an increase in weight and body mass index (BMI), which are the increasing parameters in obesity, has revealed the idea that it may be an important factor in obesity [8]. In addition, a study found a positive relationship between food addiction and obesity in children and adolescents [9]. The results obtained from studies on food addiction suggest that it is crucial to determine the factors contributing to food addiction in obese population will help to achiev obesity disease control [3]. One of these factors is depression. Even if there is an inconsistency in the relationship between obesity and depression, many studies focused on the subject [10,11].
Biological rhythm helps the body adapt to the light-dark cycle and affects eating behavior. Recent studies have shown that biological rhythm disruptions are associated with many chronic diseases, including obesity [12]. The circadian rhythm regulates anabolic and catabolic processes according to light and dark periods, and hormonal oscillations are also affected by circadian rhythm [13]. Leptin is affected by the circadian rhythm; leptin level increases in obese people and contributes to low-grade inflammation that is seen in obesity [14]. Night eating habits are one of the factors that cause obesity, and it has been shown that cortisol, leptin, and circadian melatonin secretion are impaired in these individuals [15,16]. Diabetes, metabolic syndrome, cardiovascular diseases, and obesity have increased with the acceleration of industrialization and the effect of the shift working system [17,18]. Shortening of sleep durations affects the hypothalamic-pituitary axis and increases energy intake by increasing appetite and eating rewards [19].
The effects of biological rhythm disorders lead to pathological conditions on human health, and studies are increasingly investigating this issue. However, lines of researches showing whether biological rhythm disturbance has associated with food addiction in obese individuals are very limited.
Therefore, in this study, we aimed to show whether food addiction, which is a very important factor in obesity, is associated with biological rhythm. For this purpose, we used scales that will outline the question we focused on. To assess food addiction, we used the Yale Food Addiction Scale (YFAS); for the evaluation of biological rhythm, we used the Biological Rhythms Interview of Assessment in Neuropsychiatry (BRIAN). Also, to assess the effect of eating factors on depression, we used the Beck Depression Inventory (BDI) and Beck Anxiety Inventory (BAI).
METHODS
Female patients (n=76) who applied to our outpatient clinic due to obesity and 54 females without obesity were included in this study. Firstly, height was measured with bare feet, and then fat analysis was performed on the bioimpedance device, and their weight, BMI, body fat percentage (%F), fat mass (FM), and fatfree mass (FFM) were determined by using a bioimpedance device (BC418; Arlington Heights, IL, USA). Afterward, they were asked to fill in the BRIAN, YFAS, BDI, and BAI forms.
BDI and BAI
BDI is a scale developed by Beck et al. [20] in 1961 to measure emotional, cognitive, somatic, and motivational components. The scale is comprised of 21 items that assess five categories: emotions (2 items), cognitions (11 items), behaviors (2 items), somatic symptoms (5 items), and interpersonal symptoms (1 item). This comprehensive approach allows for a thorough assessment of the many dimensions of depression. Scores ranging from 0 to 63 were obtained by assigning a score of 0, 1, 2, and 3 to each question. After completing the 21-item of BDI, scores are assigned to four categories based on the results: none/minimal depression (0–9), mild depression (10–18), moderate depression (19–29), and severe depression (30–63) [20]. The validity and reliability of the scale for use in Turkish society were tested by Tegin [21], ensuring that the scale can be effectively used to assess depression in this population.
The BAI is a self-assessment scale developed by Beck et al. [22] and is used to determine the frequency of anxiety symptoms experienced by individuals. It consists of 21 items, a Likert-type scale, and scored between 0–3. The validity and reliability of the BAI for use in Turkey were evaluated by Ulusoy et al. [23], confirming the effectiveness of the scale for assessing depression in this population.
YFAS
The YFAS, which was developed by Gearhardt et al. [24] and based on the DSM-IV-TR (Diagnostic and Statistical Manual of Mental Disorders, fourth edition, text revision) substance addiction diagnostic criteria [24] has been validated for use in Turkey through testing conducted by Bayraktar et al. [25]. This comprehensive assessment tool provides valuable insights into food addiction and its impact on individuals.
The scale consists of 27 questions. For food addiction diagnosis, at least 3 of the 7 diagnostic criteria must be met in addition to clinical significance. Clinical significance is defined as the individual’s describing the negative consequences of eating and not being successful enough in controlling the eating behavior despite the negative consequences [25].
BRIAN
BRIAN was developed by Giglio et al. [26] and comprises 21 items that provide a 4-point Likert-type assessment of sleep, activities, social and eating habits, and dominant rhythm pattern (chronotype). This assessment tool has been found to be particularly useful in determining the dominance of “morning” and “night-time” and identifying the disturbance of biological rhythms [27]. The BRIAN has been validated and shown to be reliable for use in Turkey through testing conducted by Aydemir et al. [28]. Its comprehensive assessment of various dimensions of biological rhythms can provide valuable insights into neuropsychiatric disorders. High scores imply greater disturbances in biological rhythms.
Categorization of BMI
BMI was classified according to the proposed criteria of the WHO where BMI of the following values: <18.5 kg/m2, 18.5–24.9 kg/m2, 25–29.9 kg/m2, and ≥30 kg/m2 are categorized as underweight, normal weight, overweight, and obese, respectively [29].
Statistical analysis
The Jamovi (version 2.2; https://www.jamovi.org) computer software package was used to analyze the data. It was determined whether the variables were normally distributed by using Kolmogorov– Smirnov or Shapiro–Wilk’s tests. Descriptive statistics were shown as mean and standard deviation for normally distributed variables. To compare data from different groups, t-tests were used for normally distributed data and Mann–Whitney U tests for non-normally distributed data. To examine the correlation between parameters, Pearson correlation analysis was performed. This study defined statistical significance as a type I error of 5% (p-value 0.05).
RESULTS
Demographic data (education, job status, marital status, alcohol use, and cigarette smoking) were collected from both the obese and nonobese groups. As shown in Table 1, the participants were demographically diverse.
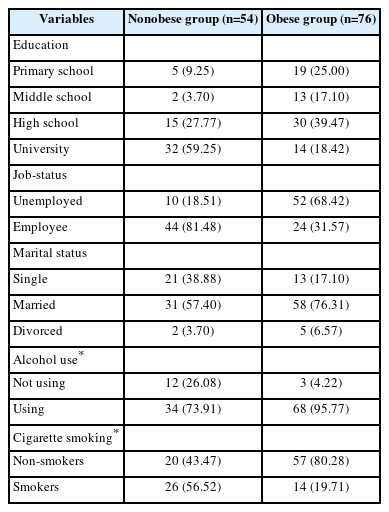
Demographic characteristics of obese and nonobese participants included in the study
Descriptive statistics related to the anthropometric characteristics of the participants are given in Table 2. BMI, %F, FM, and FFM measurements were significantly higher in obese patients than in nonobese subjects. Comparisons were made with the paired samples Wilcoxon test using Jamovi (version 2.2) computer software.
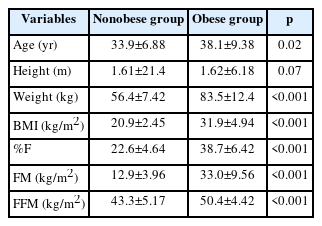
Comparison of anthropometric data of the obese and nonobese groups
The comparison results of BDI, BAI, BRIAN total and subscales with YFAS parameters between obese and nonobese groups are presented in Table 3. Results pointed that BRIAN sleep subscale (p=0.016) and YFAS scores (p<0.001) are significantly different.
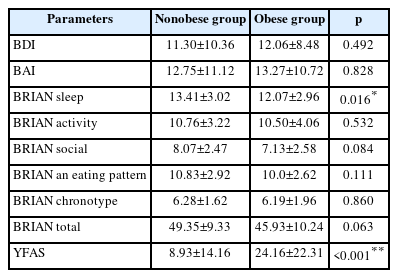
Comparison of results of BDI, BAI, BRIAN total and subscales, and YFAS parameter of the two groups
The results of the correlation analysis among obese patients and nonobese subjects are shown in Tables 4 and 5 in turn.
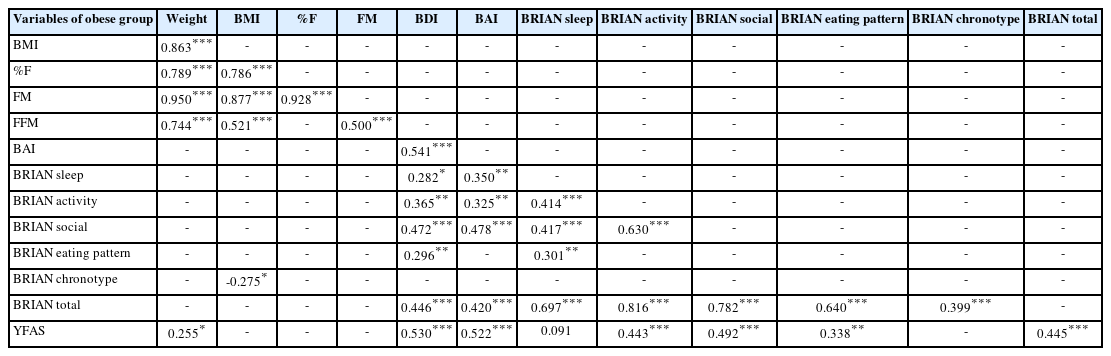
Correlation assessment in obese subjects
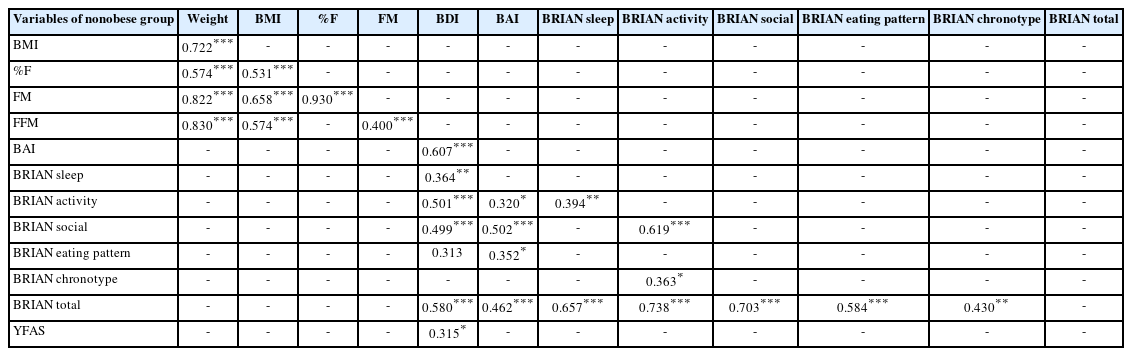
Correlation assessment in nonobese subjects
The correlation results of obese subjects show that weight, BMI, %F, FM, FFM (p<0.001), and YFAS (p<0.05) are correlated with each other in the obese group. The BAI was moderately correlated with several variables, including BRIAN sleep (p<0.05), BRIAN activity (p<0.001), BRIAN social (p<0.001), YFAS (p<0.001), and BRIAN total (p<0.001). BRIAN chronotype was negatively correlated with BMI (p<0.05). YFAS was significantly correlated with weight (p<0.05), strongly correlated with BAI (p<0.001) and BDI (p<0.001), BRIAN activity (p<0.001), BRIAN social (p<0.001), BRIAN eating pattern (p<0.001), and BRIAN total (p<0.001).
It is important to note that there were no significant correlations between adipose tissue parameters and YFAS in the obese group, suggesting that further research is needed to explore the relationship between adipose tissue metabolism and food addiction in obesity as presented in Table 4.
In nonobese subjects, BMI is significantly positively correlated with %F (p<0.001), FM (p<0.001), and FFM (p<0.001). BDI positively correlated with BRIAN sleep (p<0.001), BRIAN activity (p<0.001), BRIAN social (p<0.001), BRIAN eating pattern (p< 0.001), BRIAN total score (p<0.001), and YFAS (p<0.05). BAI positively correlated with BRIAN activity (p<0.05), BRIAN social (p<0.001), BRIAN eating pattern (p<0.05), and BRIAN total (p<0.001). Lastly, YFAS positively correlated with BDI (p<0.05) as presented in Table 5.
In summary interestingly BRIAN chronotype score and BMI were negatively correlated between obese subjects (p<0.05) but not in control subjects. Additionally, BDI and BAI were significantly positively correlated (p<0.05, p<0.001) with BRIAN subscales except for chronotype between obese patients. Finally, YFAS results were positively correlated with weight, BDI and BAI, and BRIAN subtype parameters among subjects who were diagnosed as obese. However, in the control group, there was only a positive correlation between YFAS and BDI, and there was no correlation between the YFAS and BRIAN subtype parameters.
DISCUSSION
In this study, we determined that weight, BMI, %F, FM, and FFM, which are the parameters that characterize in obesity, were not correlated with depression and anxiety. Food addiction increased proportionally with weight but was not associated with BMI, FM, %F, and FFM. In addition, food addiction increases in obese subjects concerning depression, anxiety, and biological rhythm disturbances.
In the nonobese group, weight, BMI, %F, FM, and FFM were not correlated with depression, anxiety, and YFAS score. Food addiction was not correlated with depression, anxiety, and biological rhythm in this group too.
Relationship of obesity with food addiction
According to studies, there is a correlation between food addiction and depression in individuals who are obese. Such individuals have a tendency to consume food as a means of alleviating their depressive symptoms. Additionally, those with food addiction tendencies may seek to increase dopamine levels by consuming palatable and enjoyable foods [30,31]. Recent studies have shown that it is not accurate to associate food addiction solely with depression. In fact, individuals who are obese may display behaviors indicative of food addiction even in the absence of depression [32]. In this case, the idea that food addiction can also be seen in nonobese individuals comes to mind. As a matter of fact, studies have revealed that individuals who are not obese and have no depression also have a food addiction [33,34]. After all, eating is an indispensable physiological need for maintaining life, and we feel happy when we eat because we secrete hormones [35]. When the urge to eat arises due to factors other than physiological hunger, it can potentially lead to pathological conditions and disrupt the natural balance of the body.
In this case, we see that different factors are needed to explain food addiction, and there is still no clear conclusion on this issue [36]. Current researches indicate that food addiction among obese individuals is primarily associated with an increase in body weight and BMI [37,38]. In support of these studies, we found that food addiction increases in proportion to body weight in obese individuals. Furthermore, our research has revealed that the nonobese group does not exhibit a significant correlation between body weight and food addiction. This finding is significant as it highlights the impact of body weight gain on the development of food addiction.
Relationship of obesity with biological rhythm
The relationship between obesity and biological rhythm disturbances has been widely studied. Recent studies have shown that biological rhythm disorders are a factor in obesity, as they can affect adipose tissue metabolism, sleep-wake cycles, timing of food intake, and hormonal secretion. Research on this subject continues to grow, indicating the importance of considering the role of biological rhythms in the development of obesity and related disorders [12]. Studies also have shown that CLOCK gene polymorphism associated with biological rhythm increases the risk of obesity and metabolic syndrome [39]. A study involving more than 1,000 patients determined that obese individuals have the shortest daily sleep duration, affecting their biological rhythm [40]. Moreover, it has been demonstrated that in obese individuals, leptin secretion tends to increase during the nighttime hours, along with elevated levels of growth hormone and free fatty acids [41].
In our study, unlike the literature, we found that the disturbance of chronotype decreased with the increase in BMI in obese individuals. Our findings indicate a requirement for further detailed research into the relationship between morning and evening chronotypes and obesity. It is not adequate to solely attribute the relationship between chronotype disorders and obesity.
Relationship of food addiction with biological rhythm
In this study, we determined that food addiction increased with a disturbance in biological rhythm. In support of our finding, Kandeger et al. [42] showed that biological rhythm irregularities are associated with insomnia and impulsivity in obese individuals, which in turn increase food addiction. Another study showed that food addiction is more prominent in the evening chronotype [38]. Also, the results from studies showing that disruption in sleep rhythm causes increases in the desire to eat support the relationship between the desire to eat and the biological rhythm [43]. Yilbas et al. [44] showed that food addiction is more common in evening chronotype individuals with attention deficit hyperactivity symptoms independent of obesity in university students. Additionally, studies have found that individuals with obesity tend to have disrupted biological rhythms, including changes in sleep-wake cycles and alterations in the timing of food intake. These disturbances in biological rhythms can further exacerbate food addiction behaviors, leading to a vicious cycle of overeating and weight gain. Therefore, it is crucial to consider the role of biological rhythms in the development of food addiction in obesity, as interventions targeting circadian misalignment and other biological rhythm disruptions may be effective in preventing and treating addictive-like eating behaviors in individuals with obesity.
The outcomes of these studies, as well as our own findings, are significant in that they demonstrate the associated impact of disturbances in biological rhythms on an individual’s appetite. It is plausible to consider that maintaining regularity in biological rhythms and living in harmony with the natural balance can have a positive effect on the physiological regulation of appetite. By regulating one’s desire to eat, it is conceivable that individuals may be better protected from the development of obesity.
Conclusion
We have obtained several results from this study. Firstly, the presence of depression in obese individuals was not correlated with body weight, BMI, or %F. Secondly, depression was correlated with disruptions in biological rhythm in obese individuals. Thirdly, food addiction was associated with depression, anxiety, and biological rhythm disruptions in obese individuals. In the nonobese group, food addiction was only associated with depression. Fourthly, food addiction was not associated with adipose tissue parameters in obese individuals, and it is seen that there is limited information in the literature to explain this relationship. Adipose tissue parameters and obesity are closely interrelated. Adipose tissue is a connective tissue that plays a significant role in energy metabolism, storage, and release. Obesity is characterized by an excessive accumulation of adipose tissue, leading to an increase in body weight and BMI. Several adipose tissue parameters are associated with obesity, including adipose tissue thickness, volume, distribution, and adipocyte size. In obese individuals, the adipose tissue parameters are significantly altered, leading to metabolic dysfunction, insulin resistance, and chronic inflammation. Additionally, obesity-related adipose tissue dysfunction is linked to the development of several metabolic disorders. Therefore, understanding the adipose tissue parameters and their relationship to obesity is crucial in developing effective preventive and therapeutic interventions for obesity-related disorders. This result also suggests that there is a need for detailed studies on the relationship between adipose tissue metabolism and food addiction. As a result, if the person is both obese and has been diagnosed with food addiction with the YFAS test, obesity may have emerged as a continuation of depression, anxiety, and biological rhythm disruptions.
In conclusion, our study highlights the importance of considering depression, anxiety, and biological rhythm disruptions in the development of food addiction and obesity. The results suggest that disruptions in biological rhythms may play a significant role in the development of food addiction in obese individuals. Moreover, our findings indicate that there is a need for more detailed studies to understand the relationship between adipose tissue parameters, food addiction, and obesity. Effective preventive and therapeutic interventions for obesity-related disorders could be developed by understanding the relationship between adipose tissue parameters and obesity. Overall, the study emphasizes the complexity of the relationship between food addiction, biological rhythms, and adipose tissue metabolism, indicating the need for further research in this area.
Notes
Funding Statement
None
The authors have no potential conflicts of interest to disclose.
Availability of Data and Material
The datasets generated or analyzed during the study are available from the corresponding author on reasonable request.
Author Contributions
Conceptualization: Serpil Çeçen. Data curation: Serpil Çeçen. Formal analysis: Zozan Guleken. Investigation: Serpil Çeçen, Zozan Guleken. Methodology: Serpil Çeçen, Zozan Guleken. Project administration: Serpil Çeçen. Software: Zozan Guleken. Supervision: Zozan Guleken. Writing—original draft: Serpil Çeçen. Writing—review & editing: Serpil Çeçen, Zozan Guleken.