The Influence of Sleep Quality on the Body Composition, Selective Attention, and Autonomic Nervous System Activity in Healthy Individuals
Article information

Abstract
Objective
This study aimed to investigate whether the sleep quality is associated with body composition, selective attention, and autonomic nervous system (ANS) activity in healthy young individuals.
Methods
This cross-sectional study was conducted using the Korean version of Pittsburgh Sleep Quality Index (PSQI-K). Sixteen healthy volunteers aged 20–26 years participated in this study. The PSQI-K was used to evaluate sleep quality, and they were divided into good and poor sleeper groups by PSQI-K. Body composition, and both reaction time and error number for discriminative reaction task indicating the selective attention, and ANS activity were measured and it compared according to sleep quality. Additionally, the correlation between sleep quality and ANS activity was analyzed.
Results
There were no significant differences in the body composition, reaction time and error number between good and poor sleeper groups. In the ANS activity, the poor sleeper group only showed the lower HF value than the good sleeper group in resting state (p=0.023). Whereas, the amount of change (reaction task state – resting state) in mean HR (p=0.005), HF (p=0.039), and LF/HF ratio (p=0.023) were significantly different between the groups. Additionally, a negative correlation was observed between PSQI-K and HF (p=0.005), while a positive correlation was confirmed between PSQIK and LF/HF ratio (p=0.012).
Conclusion
These findings indicate that even healthy individuals may have physiological problems such as ANS imbalance if the sleep quality is poor.
INTRODUCTION
It is known that sleep is an important element for maintaining physical and mental health, and it plays a major role in restoring homeostasis. The body homeostasis and sleep homeostasis rely on the complicated integrative activity by the hypothalamus [1]. The hypothalamus is an important neuroanatomical area for homeostasis. The ventrolateral preoptic area (VLPO) in the hypothalamus is a sleep-promoting area associated with homeostasis mechanism of sleep. In the VLPO, the c-Fos immunoreactive level of the sleep-regulated neural source is correlated with the amount of sleep, and it was greatly increased during recovery sleep after sleep deprivation [2]. Sleep exert strong regulatory influence on immune functions, it promotes the increase in cytokines, which promote the interaction between antigen-presenting cell and helper T cell. Moreover, sleep is associated with inflammatory endocrine system, which is specified by high growth hormone and prolactin, and low cortisol and catecholamine hormone [3]. Sleep deprivation is considered a stressor that induces an increase in cortisol and corticosterone levels [4].
Sleep is influenced by the biological factors such as age and gender [5], moreover the activity and balance of the autonomic nervous system (ANS) [6]. The poor sleep quality causes mental and physical changes that 1) induce fatigue, anxiety, and stress affecting the ANS activity; 2) reduce concentration and attention; and 3) cause physical changes such as obesity and weight gain [7-10]. Therefore, sleep quality is related with not only physiological elements such as body composition and ANS activity, but also mental elements including attention and cognition.
Previous study reported that shortened sleep duration could lead to overweight by increasing food intake [10]. It could be explained physiologically that insufficient sleep causes an imbalance of the secretion of leptin and ghrelin which are hormones that control appetite, promoting excessive food intake, which leads to weight gain [11]. Leptin is a hormone composed of 167 amino acids, and is an obesity-related gene that acts a major role in controlling food intake and energy consumption [12,13]. And, ghrelin is a peptide hormone composed of 28 amino acids, which stimulates the secretion of growth hormone and stimulates appetite [14]. Sleep deprovation reduces the secretion of leptin and increases the secretion of ghrelin, which affacts obesity [11]. It has been demonstrated that the shorter sleep duration increases the waist circumference and the caloric intake, suggesting that there is a correlation between sleep duration and body composition [15,16]. In addition, these changes in metabolic indicators, including body fat, are also linked to sleep quality [17].
Sleep is an essential factor in psychophysiology in that it is a pivotal modulator of neuroendocrine function related to cognition. Poor sleep quality reduces concentration and memory, thereby affecting cognitive function and learning [9]. Previous study reported that insufficient sleep caused delay in reaction time during reaction tasks, indicating that sleep deprivation affected cognitive functions [18].
Sleep is related to the ANS in terms of physiology, maintaining homeostasis which is regulated by the activities of sympathetic and parasympathetic nervous systems [19]. ANS activity could induce the various events during sleep such as bruxism, it is closely associated with sympathetic as well as parasympathetic nerve activities [20]. The evaluation of ANS activity is divided into analyses of time and frequency domain [21]. Heart rate variability (HRV), which is included to time domain, refers to the periodic changes in heartbeat and reveals the ANS state that regulates heart activity [22]. The frequency domain of HRV indicates the ANS activity by analyzing the frequencies in the different bands [23]. Therefore, HRV is used as an indicator of balance between the sympathetic and parasympathetic nerves. The activity of ANS can affect heart rate control directly; sympathetic nerve facilitates the heart rate quickly, and parasympathetic nerve operates the heart rate slowly. Therefore, it could balance the heart rate for proper regulation of heartbeat.
Due to the ANS activity that varies depending on the resting and the stress state, it is necessary to assess the ANS activity by separating the resting and stress states [21-23]. Thus, we measured ANS activity by dividing it into resting state (no reaction task) and stress state (reaction task). In previous studies, the ANS activity was evaluated mainly in subjects who have sleep disorders such as sleep apnea and narcolepsy [19, 24]. However, there are a few studies that investigate the effect of sleep quality on the ANS activity in healthy young adults. Therefore, the aims of this study were 1) to investigate whether the sleep quality affects body composition, selective attention, and ANS activity in healthy adult with no sleep disorder; 2) to identify whether ANS activity according to the quality of sleep is changed in resting state (no reaction task) and stress state (reaction task); additionally, 3) to identify the correlation between the sleep quality and ANS activity. This study could provide the basic data to help improve the sleep quality, physical health, and learning ability for healthy adults.
METHODS
Subjects
A total of 21 healthy young adults aged 20 to 26 years participated in this study. Exclusion criteria were medicine related to sleep taken within the last 24 hours, a history of musculoskeletal or neurological or cardiovascular disorders in the previous 12 months, and chronic pain in any region, visual or vestibular problems, dizziness, and severe headache. Five subjects were ruled out based on exclusion criteria and remaining 16 subjects (8 males and 8 females) matched the criteria were included in this study. This study was conducted in accordance with the Declaration of Helsinki and approved by the Institutional Review Board of the College of Health and Welfare, Woosong University (approval no. 1041549-210413-SB-118), and all subjects were briefed on the study and provided written informed consent prior to participation. Each participant were given explanations of study procedures and voluntarily signed an informed consent before study commencement.
To assess sleep quality, the Korean version of the Pittsburgh Sleep Quality Index (PSQI-K) questionnaire was used. Based on the results of this questionnaire, the subjects were divided into a good sleeper group (n=9) and a poor sleeper group (n=7). The total score of less than 6 (0–5 score) was divided into good sleeper group, and the total score of 6 or more (6–21 score) was divided into poor sleeper group [18]. Table 1 shows the characteristics and PSQI-K scores of participants.
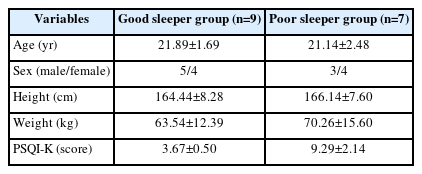
General characteristics and PSQI-K score of participants
Procedure
Body composition, reaction time and error number for discriminative reaction task, and ANS activity according to sleep quality were analyzed (Figure 1). All subjects performed the discriminative reaction task, and they were asked to respond to target stimulus. Reaction time and number of incorrect responses (error number) were recorded automatically. ANS activity was measured by separating resting state (no reaction task) and reaction task state (Figure 2). Additionally, the correlation between sleep quality and ANS activity was analyzed without classifying the group.
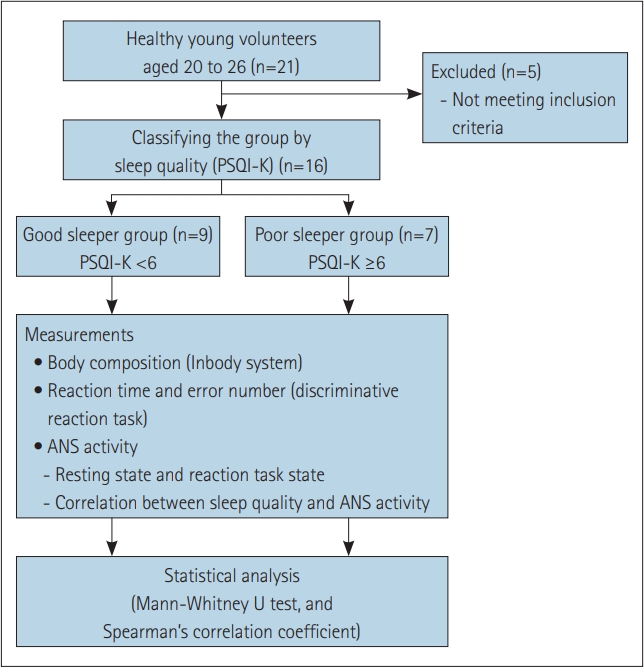
Experimental scheme of present study. Sleep quality was assessed by PSQI-K, then the individuals were divided to good and poor sleeper group by this score. Body composition, reaction time and error, and ANS activity were measured to compare between the groups. PSQI-K, Korean version of Pittsburgh Sleep Quality Index; ANS, autonomic nervous system.
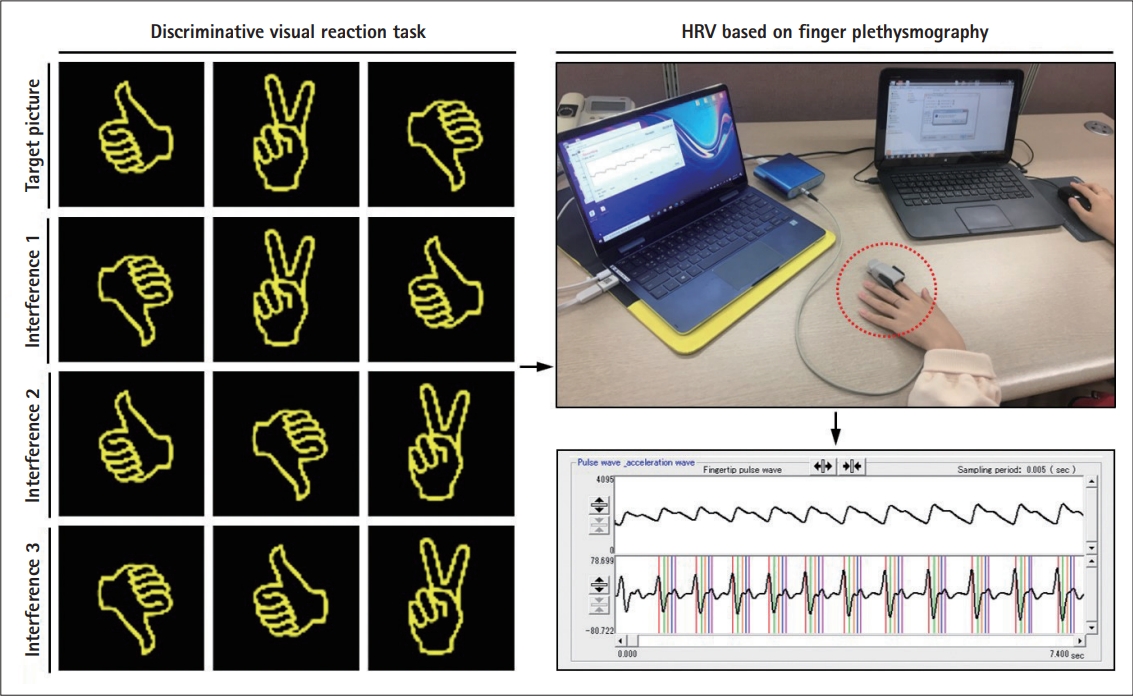
Experimental procedures of evaluation used in this study. Reaction time and error number, HRV were measured during discriminative visual reaction task. Signals from HRV showing the activity of ANS were recorded based on finger plethysmography non-invasive method, as indicated by a red dotted circle. This illustration is derived from 'Measurement of Reaction Time to Stimulation' (Ver. 1.5.2, provided by Seoul National University, Seoul, Korea) and BACS ADVANCE program (TAOS Institute, Inc., Yokohama, Japan). HRV, heart rate variability; ANS, autonomic nervous system.
Sleep quality
Sleep quality was measured using the PSQI-K questionnaire. PSQI-K is a self-reporting measure for evaluating sleep quality within a month, consisting of total 18 questions. It evaluates seven factors about sleep—subjective sleep quality, sleep latency, sleep duration, habitual sleep efficiency, sleep disturbance, use of sleep medication, and daytime dysfunction. The scores for each item are 0–3 points; a score of 0 means no difficulty sleeping, and a score of 3 means serious difficulty sleeping. The total score range of PSQI-K is a minimum of 0 and a maximum of 21 points. The low score means a good quality of sleep, and a high score means a poor quality of sleep. The reliability coefficient of PSQI-K was 0.69 [25].
Body composition
The body compositions were measured using Inbody system (Inbody120, Inbody Co., Ltd., Seoul, Korea). This analyzed body mass index (BMI), skeletal muscle mass, body fat mass, percent body fat, and waist-hip ratio. To measure body composition, the subjects stand on the Inbody footplate. After then, the subjects held the probe in both hands and looked forward to measureing the body composition.
Reaction time and error number
To assess selective attention according to sleep quality, all subjects performed the reaction task to visual stimuli using software “Measurement of Reaction Time to Stimulation” (Ver. 1.5.2, provided by Seoul National University, Seoul, Korea). Particularly, discriminative reaction task that induces the visual interference effect was used in this study. In the discriminative task, a single picture was shown to the subject, and then the subject was required to press the mouse when the same picture among similar picture appeared. Meantime, reaction time and error number for each set were recorded automatically. A total five sets were performed, with a 1 minute rest between each set. To minimize the impact of the external environment, intervention was conducted without external noise, and the room temperature was maintained between 22°C–24°C. The subjects used same chair and were requested to maintain the same posture.
ANS activity
ANS activity was measured using BACS ADVANCE (TAOS Institute, Inc., Yokohama, Japan), which is based on finger plethysmography non-invasive method [26]. The finger of subject was attached to a finger sensor, then applying a constant pressure (25 mm Hg) to measure the blood flow. In this study, the ANS activity was measured by separating the resting state and reaction task state. In the resting state, the subjects were sitting comfortably in the backrest chair for 5 minutes. After that, in the reaction task state, the subject performed a discriminative reaction task to visual stimuli for 5 minutes as described. ANS activity was measured for 5 minutes respectively, and then mean value at the middle 3 minutes was used excluding the values for the first and last minutes.
All features of both time and frequency domain representing ANS activity were analyzed. First, time domain features include mean heart rate (HR), standard deviation of NN interval (SDNN), root mean square of successive difference (RMSSD), and coefficient of variation of R-R interval of the heart rate (CVRR). SDNN represents the state of the cardiovascular system and the rhythm of the heart rate, and its decrease indicates that the ANS does not properly respond to environmental changes [21]. Also, both RMSSD [22] and CVRR [27] indicate the activity of parasympathetic nerves. Second, frequency domain analysis is useful to assess the balance of sympathetic and parasympathetic nerves. To evaluate frequency domain features, total power (TP), high frequency band (HF), low frequency band (LF), very low frequency band (VLF), and LF/HF ratio are analyzed. TP represents the overall activity of the ANS as a sum of all frequency domains. HF is a high-frequency component between 0.15 Hz and 0.4 Hz, indicating parasympathetic nerve activity [23]. LF is a low-frequency component between 0.04 Hz and 0.15 Hz, indicating the activities of sympathetic and parasympathetic nerves [28]. VLF is a frequency domain between 0.003 Hz and 0.4 Hz, which is affected by both sympathetic and parasympathetic nerves, but is often not clinical interpretation due to long cycles and unclear physiological mechanism [22,23]. The LF/HF ratio reflects the degree of balance between the sympathetic and parasympathetic nerves, indicating the degree of activity of the sympathetic nerves to the parasympathetic nerves. In addition, by analyzing chaotic attractor image and power spectral density, the ANS response in resting state and reaction task state was compared. The chaotic attractor image represents the sum of the finger pulse waveforms for 3 minutes.
Statistical analysis
Analysis was performed using SPSS Statistics version 25.0 for Windows (IBM Corp., Armonk, NY, USA). The Mann-Whitney U test was used to compare the body composition, reaction time and error number, and ANS activity according to sleep quality. Additionally, the amount of change in ANS activity (reaction task state – resting state) between the good and poor sleeper groups was analyzed using the Mann-Whitney U test. Spearman’s correlation coefficient was used to calculate the correlation between the sleep quality (PSQI-K score) and ANS activity without classifying the group. Difference was considered statistically significant when the p-value was <0.05.
RESULTS
Body composition by sleep quality The analysis of body composition of each group is shown in Table 2. Although there were no significant differences between the good and poor sleeper groups, poor sleeper group showed the high values in all variables of BMI, skeletal muscle mass, body fat, percent of body fat, waist-hip ratio compared to good sleeper group.

Body composition analysis according to sleep quality
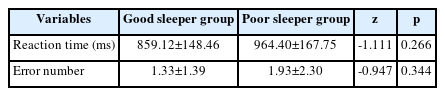
Reaction time and error number by sleep quality
The reaction time for the discriminative reaction task was increased in the poor sleeper group (964.40 ms) than the good sleeper group (859.12 ms). The number of errors was higher in the poor sleeper group (1.93 times) than in the good sleeper group (1.33 times). However, there were no significant differences between the groups in both reaction time and error number (Table 3).
Selective attention task according to sleep quality
ANS activity by sleep quality
ANS activity was measured by separating resting state (no reaction task) and reaction task state, and these parameters were compared between good and poor sleeper groups (Table 4). In the resting state, the poor sleeper group (218. 91 ms2) had the lower HF value than the good sleeper group (547.43 ms2), and there was statistically significant difference between the groups (p=0.023). All parameters except HF did not show the significant differences between the groups in the resting state. In the reaction task state, all parameters did not show the significant differences between the groups. The difference value in ANS activity (reaction task state – resting state) was compared between the good and poor sleeper groups. There were statistically significant difference in the mean HR (good sleeper group: 3.87 bpm, poor sleeper group: -2.58 bpm, p=0.005), HF (good sleeper group: -204.60 ms2, poor sleeper group: 120.96 ms2, p=0.039), LF/HF ratio (good sleeper group: 0.38, poor sleeper group: -2.30, p=0.023) between both groups. Particularly, the change of LF/HF ratio was more marked in the poor sleeper group than good sleeper group, which was confirmed in the chaotic attractor image and power spectrum in HRV obtained during measurement of ANS activity in the resting state and reaction task state (Figure 3).
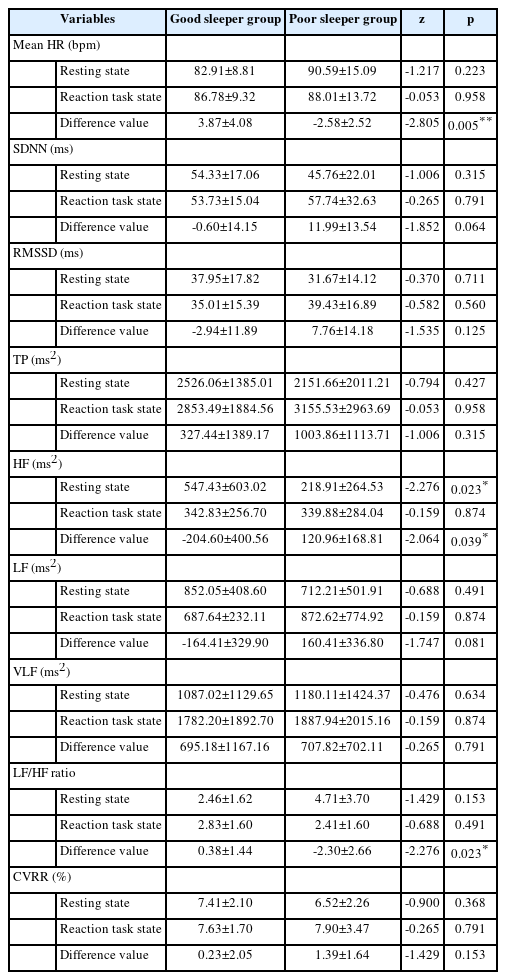
ANS activity of good and poor sleeper groups

Examples of autonomic nervous system (ANS) activity via heart rate variability (HRV) in current study. A: An example of chaotic attractor image of poor sleeper group. The size of chaotic attractor image was attenuated during the reaction task state compared to the resting state. Upper table, fingertip pulse wave measure at the resting state; lower table, fingertip pulse wave measure at the reaction task state. B: An example of power spectrum in HRV of poor sleeper group. During the reaction task state, parasympathetic nerve activity was increased compared to the resting state. 0.04–0.15 Hz (low frequencty band, LF), sympathetic nervous system; 0.15–0.4 Hz (high frequency band, HF), parasympathetic nervous system.
Correlation between sleep quality and ANS activity
Correlation between sleep quality and ANS activity was analyzed (Table 5). In the resting state, there was a significant negative correlation between PSQI-K score and HF (r=-0.667, p=0.005). Moreover, an obvious positive correlation was identified between PSQI-K score and LF/HF ratio (r=0.608, p=0.012). As PSQI-K score was increased, HF was fallen appreciably while LF/HF ratio was risen notably. However, there were no significant relationships between PSQI-K score and parameters of ANS activity at the reaction task state.
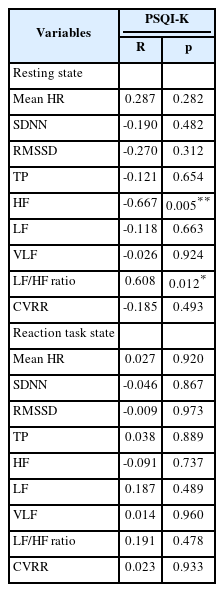
Correlation between sleep quality and parameters of ANS activity in resting and reaction task states
DISCUSSION
The purpose of this study was to investigate whether the sleep quality, as classified by the PSQI-K, could influence the body composition, selective attention, and ANS activity in healthy young individuals. In particular, ANS activity was identified in both resting and reaction task states, as well as the amount of change was compared between the both groups.
Recent evidences have suggested that sleep is associated with obesity [16,29,30]. Reduced sleep duration and quality are related to the weight gain and adiposity [29], and there is a significant negative relation between sleep duration and waist circumference, which is a measure of central adiposity [15]. Moreover, poor sleep quality and short sleep duration were related to obesity in middleaged and older adults [30]. Whereas, both short and long sleep durations might be related to obesity or higher BMI [31]. WHO defined the standard of obesity in the Asia-Pacific region as a BMI of 25 kg/ms2 or higher. Based on this criteria, BMI and percent body fat of the poor sleeper group were 25.34 kg/ms2 and 31.09% in this study, respectively. Although all body composition factors were higher in poor sleeper group compared to good sleeper group, it was not significantly different in this study. These results might indicate that the subjects did not show the significant metabolic changes due to the subjects not being diagnosed with sleep disorders medically. Additionally, in this study, dietary and physical activity were not considered. Not only sleep quality but also diet and physical activity are the main factor contributing to body composition [32]. Therefore, in future studies, various factors that affect body composition, such as diet and physical activity, should be measured together.
Sleep deprivation influences several domains of cognitive functioning [33]. In particular, reaction time and working memory are known to be the most sensitive to short-term sleep deprivation [34]. Since the reaction time represents the time until responding to various stimuli, thus it can indicate attention, which is one of the components of cognitive function. Attention, which is the ability to process and respond to various environmental stimuli, has four major components; tonic alertness, phasic alertness, selective attention, and sustained attention [35]. These attentional networks are most sensitive to insufficient sleep [36]. Ferrie et al. [37] showed that a reduced sleep duration can provoke the fatigue and decrease in concentration, causing psychophysiological changes as well as attention and cognitive dysfunctions. In this study, participants performed the discriminative reaction task to use the interference effect through multi stimuli, which was to measure the selective attention. Reaction time and number of errors were increased in poor sleeper group than in the good sleeper group; however, there was no significant difference between the groups. Commonly, reaction time is widely used to assess the cognitive functions that are known to influence academic performance [38], also to evaluate neuromuscular-physiological responses in sport athletes [39]. However, human body responds to various stimuli at different speeds [40], additionally, the factors including intensity and duration of the stimuli, age and gender of the subjects, and effect of practice can influence the reaction time of an individual [41]. In the present study, the reason why there was no significant difference in reaction time could be that some of these factors affected the evaluation of reaction time related to sleep quality. Gobin et al. [42] reported that overall relationship between PSQI and attention was not supported; however, poor sleep quality was associated with a deficit in sustained attention. This study supported the previous study because there was no significant difference in selective attention between groups according to the PSQI. Thus, it will be necessary to investigate the relationship between sleep quality and sustained attention by applying continuous or more complex task in future study.
Sleep deficits could induce excessive activity in the stress response system, and they cause alterations in ANS [43]. Consequently, HRV is known to be affected by sleep-related problems such as insomnia and poor sleep quality [6]. In this study, ANS activity according to sleep quality was measured in a resting state and performing the reaction task, respectively. In the resting state, only frequency domain index HF showed significant difference between good and poor sleeper groups (p=0.023). The HF indicator which is reflecting the activity of the parasympathetic nervous system [44], was significantly lower in the poor sleeper group compared to the good sleeper group. However, the time domain indices RMSSD and CVRR values, which are the component of the parasympathetic nervous system activity, were no statistical significance between good and poor sleeper groups. It is known that the analysis of HRV includes long-term and short-term analyses, and the analytical data that are less than 10 minutes are considered as short-term HRV analysis [45]. In general, frequency domain analysis might be of value in short-term HRV analysis [46]. Since we measured HRV for 5 minutes in the resting state, thus it is considered that the frequency domain index (HF) showed a significant change than the time domain index (RMSSD and CVRR) in the present study. Zhong et al. [47] have described that the sleep deprivation induced the activation of sympathetic nervous system for the heart, while the regulatory ability of the parasympathetic nervous system was reduced. Besides, HF showed higher correlation with sleep quality in stressful a situation compared to in a resting state [6,48]. The LF/HF ratio is an index indicating the degree of sympathovagal balance [47], and is proportional to the activity of sympathetic nervous system [43]. The reference value of LF/HF ratio is known as 0.5–2.0. LF/HF ratio was higher in poor sleeper group (4.71±3.70) than in good sleeper group (2.46±1.62) in the resting state; however, there was no significant difference in this study. Further study should be conducted with a larger sample size to investigate the correlation between sympathovagal balance and sleep quality.
Various interventions including physical activities have been used to improve the physiological imbalance of ANS. It was reported that as the time for exercise was increased, the parasympathetic nerve was activated [49], moreover as the performance number of aerobic exercises increases, RMSSD indicating parasympathetic nerve activity was improved [50]. These effects of physical exercise on the ANS were also confirmed in patients with cognitive deficiency. Previous study showed that physical exercise can lead to a recovery of the responsiveness of the parasympathetic system in Alzheimer’s dementia [51]. Furthermore, static activity such as meditation induced a decrease in HR and an increase in RMSSD, also a reduction in salivary cortisol levels [52]. Thus, the effect of the discriminative reaction task on ANS activity was examined, and compared according to sleep quality. The amount of change in ANS activity (reaction task state – resting state) showed significant difference in the mean HR (good sleeper group: 3.87 bpm, poor sleeper group: -2.58 bpm), HF (good sleeper group: -204.60 ms2, poor sleeper group: 120.96 ms2), and LF/HF ratio (good sleeper group: 0.38, poor sleeper group: -2.30) between both groups. These results mean that LF/HF ratio (sympathetic nerve activity) was reduced, and HF (parasympathetic nerve activity) was increased during the poor sleeper group performing the discriminative reaction task. The previous study reported that the tension of sympathetic nervous system was relieved and the parasympathetic nervous system was activated while performing attention-oriented task [53]. In the present study, the changes of ANS activity during the reaction task were more pronounced in the poor sleeper group, which could be explained that attention-oriented activity might have an intervention effect on the restoration of the ANS balance. ANS plays an important role in regulating attention, thus HRV could be considered as a predictor of change of attention [54]. When concentration is induced, spontaneous electrical activities are occurred in the central nervous system, and various physiological changes are happened in the autonomic nervous system [55]. Therefore, alterations in ANS activity can be used to measure the attention level [56,57]. Especially, performing a reaction task that requires selective attention facilitates the ANS, which is considered to affect the balance control of the sympathetic and parasympathetic nerves. However, most of the previous studies on selective attention training have mainly on school-age children, attention-deficit/hyperactivity disorder (ADHD) children, or the elderly, and studies related to sleep are insufficient. Thus, it is considered that further studies are needed on the relationship of sleep disorders, sleep-related stress-inducing factors, and selective attention in healthy adults.
In this study, correlation between sleep quality and ANS activity was analyzed. In the resting state, a significant negative correlation was confirmed between the HF and the PSQI-K score (r=-0.667, p=0.005), whereas a significant positive correlation was identified between the LF/HF ratio and the PSQI-K score (r=0.608, p=0.012). These results indicated that as the PSQI-K score was increased, HF was decreased and the LF/HF ratio was increased. It suggested that poor sleep quality attenuated the parasympathetic nerve activity, and enhanced the sympathetic nerve activity. Previous study on college students found that there was a negative association between sleep efficiency and LF [58]. The control ability of ANS on cardiovascular system after sleep deprivation is dysregulated by the decrease of RMSSD and the HF, and increase of LF and the LF/HF ratio [47,59]. Therefore, the significant correlation between sleep quality and ANS activity reveals that poor sleep quality could interfere with ANS function.
This study has a few limitations. Since this study was conducted only on healthy college students, it is difficult to generalize to subjects of different ages, and the sample size is also not sufficient. Second, in the self-reported PSQI-K survey conducted to evaluate the sleep quality, only the overall patterns of the sleep habits and sleep patterns were investigated without dividing them into weekdays and weekends. Since college students generally have irregular sleeping habits, such as shortened sleep time due to preparation for major classes or employment, thus they might experience deterioration of sleep quality. Despite these limitations, it seems to be significant to study on the sleep quality and ANS activity of college students. Therefore, further studies should consider these relevant factors and a large sample size to generalize of meaningful results of present study. Also, we plan to investigate the features of ANS functions and relevant factors of college students in further studies to understand the mechanism of ANS changes related to sleep quality.
In conclusion, this study revealed that the adverse effect of poor sleep quality on ANS activity was significantly increased in healthy college students. In this results, the value of HF indicating the activity of parasympathetic nerve was lower in the poor sleeper group in the resting state. ANS activity was significantly changed between resting and reaction task states in both groups, particularly, these alterations were notable in the poor sleeper groups. The activity of sympathetic nerve was decreased, while parasympathetic nerve was activated in the poor sleeper group at the reaction task state. And, we found that the PSQI-K score significantly correlated with HF and LF/HF ratio at resting condition. These results suggested that the degradation of sleep quality had an effect on the parasympathetic inactivation, as well as the sympathetic hyperactivation.
Notes
Funding Statement
This work was supported by the National Research Foundation of Korea (NRF) grant funded by the Korea government (MSIT) (No. NRF-2014R1A1A3051724).
The authors have no potential conflicts of interest to disclose.
Availability of Data and Material
The datasets generated or analyzed during the study are available from the corresponding author on reasonable request.
Author Contributions
Conceptualization: Sookyoung Park. Data curation: Sookyoung Park. Formal analysis: Sookyoung Park. Investigation: Sieun Park. Methodology: Sookyoung Park. Software: Sieun Park. Validation: Sieun Park. Writing—original draft: Sieun Park, Sookyoung Park. Writing—review & editing: Sieun Park, Sookyoung Park.