Association between Atherogenic Index of Plasma and the Risk of Obstructive Sleep Apnea in Korean Adults Who Admitted to the Sleep Clinic
Article information
Abstract
Objective
Atherogenic index of plasma (AIP) is closely related to insulin resistance, which is a major characteristics of obstructive sleep apnea (OSA). However, data on the association between AIP and OSA has been limited. This study evaluated the association of AIP with OSA.
Methods
AIP was assessed in 180 consecutive Korean adults with suspected OSA who admitted to the sleep clinic between 2010 and 2012. OSA was defined as the occurrence of more than 5 apnea-hypopnea index (AHI) events/h. All participants were divided into three groups according to the AIP tertiles, which were determined by the log of (triglyceride/high-density lipoprotein cholesterol).
Results
The prevalence of OSA increased [group I (lowest): 73.8%; group II: 86.4%; group III (highest): 91.7%] as increasing AIP tertiles (p=0.022). AIP had a positive correlation with AHI (r=0.210; p=0.005). In univariate linear regression analysis, AIP (per 0.1-unit increase) was significantly related to AHI (β=2.460; p=0.005). Univariate logistic regression analysis showed that AIP was associated with an increased risk of OSA [odds ratio (OR): 1.450; 95% confidence interval (CI): 1.179–1.785; p<0.001]. However, this association was attenuated after adjusting for multiple risk factors including age, male sex, alcohol consumption, obesity, and smoking (OR: 1.252; 95% CI: 0.995–1.575; p=0.055).
Conclusion
Despite a significant correlation of AIP with AHI, AIP was not an independent predictive marker for OSA beyond multiple risk factors. Further investigation with larger sample size might be necessary.
INTRODUCTION
Obstructive sleep apnea (OSA) is a major health problem which is closely related to arousal, sympathetic activation, and oxygen desaturation during sleep. The prevalence of OSA in the general population is estimated to be 9% to 38%; OSA is more common in males, the elderly, and obese individuals relative to the general population [1]. It is well-established that OSA contributes to the increase of cardiovascular morbidity and mortality [2,3].
Subjects with OSA display clinical features similar to those with metabolic syndrome which represents insulin resistance as major characteristics [4,5]. Recently, the atherogenic index of plasma (AIP), which is calculated by log [triglyceride/high-density lipoprotein cholesterol (HDL-C)] [6], has been considered as a useful marker for plasma atherogenicity based on its significant association with lipoprotein particle size, cholesterol esterification rates, and remnant lipoproteinemia [6–8]. In addition, the AIP is closely correlated with the degree of insulin resistance [9]. However, data regarding the significance of AIP on OSA had been limited in clinical practice. In the present study, we aimed to evaluate the association between AIP and OSA in Korean adults with suspected OSA.
METHODS
Subjects and study design
This study retrospectively analyzed clinical characteristics of 180 consecutive patients referred to the sleep clinic for polysomnography examinations at St. Paul’s Hospital between January 2010 and October 2012. All patients had at least one symptom suggesting OSA, including snoring, excessive daytime sleepiness, witnessed apneic incidents, and nocturnal choking. Overnight polysomnographic examination with a SomnoStar Pro 7–3a system (Cardinal Health, Inc., Dublin, OH, USA) was performed on all participants. Electroencephalographic, electrooculographic, electrocardiographic, and electromyographic surface electrodes were used to record participant data. Nasal and oral airflow, tracheal sounds, thoracic and abdominal movement, and positional changes during sleep were also recorded. Transcutaneous peripheral oxygen saturation (SpO2) was monitored with a pulse oximeter. After data collection using a computerized polysomnographic system, a manual scoring was performed. Rechtschaffen and Kales criteria [10] was used to define sleep status. The criteria of the American Academy of Sleep Medicine were applied for respiratory events [11]. Airflow reduction of ≥90% of baseline values for ≥10 s was defined as apnea. Events involving ≥30% airflow reduction for ≥10 s accompanied by a ≥3% drop in oxygen saturation or arousal were defined as hypopnea. Apnea-hypopnea index (AHI) was defined as the number of apnea or hypopnea events per hour that occurred during sleep. OSA was defined as the occurrence of ≥5 AHI events/h; the severity was defined as mild (5 ≤AHI<15), moderate (15≤AHI<30), and severe (AHI≥30) based on the number of events per night of sleep [12]. All blood samples were obtained after at least 8 h fasting. All subjects completed a questionnaire about alcohol consumption and smoking history. Alcohol intake was calculated based on the daily recall of consumption. Regardless of the type of alcohol, alcohol consumption of less than 12 cups in one’s lifetime was considered to have no alcohol history. Smokers reported a smoking history of at least 2 years, currently smoked more than 20 cigarettes/day. Ex-smokers reported a history of past exposure to nicotine (≥5 cigarettes in lifetime), but no current smoking. Never-smokers smoked fewer than five cigarettes in their lifetimes. Body mass index (BMI) was defined as the patient’s weight (kg)/height (m2). Obesity was defined as a BMI of ≥25 kg/m2 based on the cut-off values for Asians. Excessive daytime sleepiness was defined as Epworth sleepiness scale score >10 [13]. The Institutional Review Board of St. Paul’s Hospital approved the protocol (PC14OISI0059), and all participants provided written informed consent.
Statistical analysis
Continuous and categorical variables are presented as mean± standard deviation and number (percentage), respectively. One-way analysis of variance was used to compare continuous variables. The χ2-test or Fisher’s exact test was used to compare categorical variables. Pearson’s correlation test was used to evaluate the correlation between variables. Univariate linear regression analysis was used to identify the association between clinical variables and AHI. Univariate and multivariate logistic regression analyses were performed to identify independent risk factors for OSA. The forced entry method was used to enter independent variables into the multiple regression analysis. All statistical analyses were performed with the Statistical Package for the Social Sciences version 19 (IBM Corp., Armonk, NY, USA). p values <0.05 were considered statistically significant.
RESULTS
Baseline characteristics of all participants are included in Table 1. The mean age of the participants (133 males, 73.9%) was 48.6±13.8 years. Mean BMI values were 26.4±4.1 kg/m2; and the prevalence of obesity was 59.4%. The prevalence of alcohol consumption and smoking were 61.1% and 37.2%, respectively. The mean levels of total cholesterol, triglyceride, HDL-C, and low-density lipoprotein cholesterol (LDL-C) (mg/dL) were 186.3±39.7, 163.2±94.0, 47.6±11.5, and 113.6±35.6, respectively. Mean AIP values were 0.50±0.24. The mean AHI levels determined for all study participants were 31.6±28.3/h, and the overall prevalence of OSA was 83.9%.
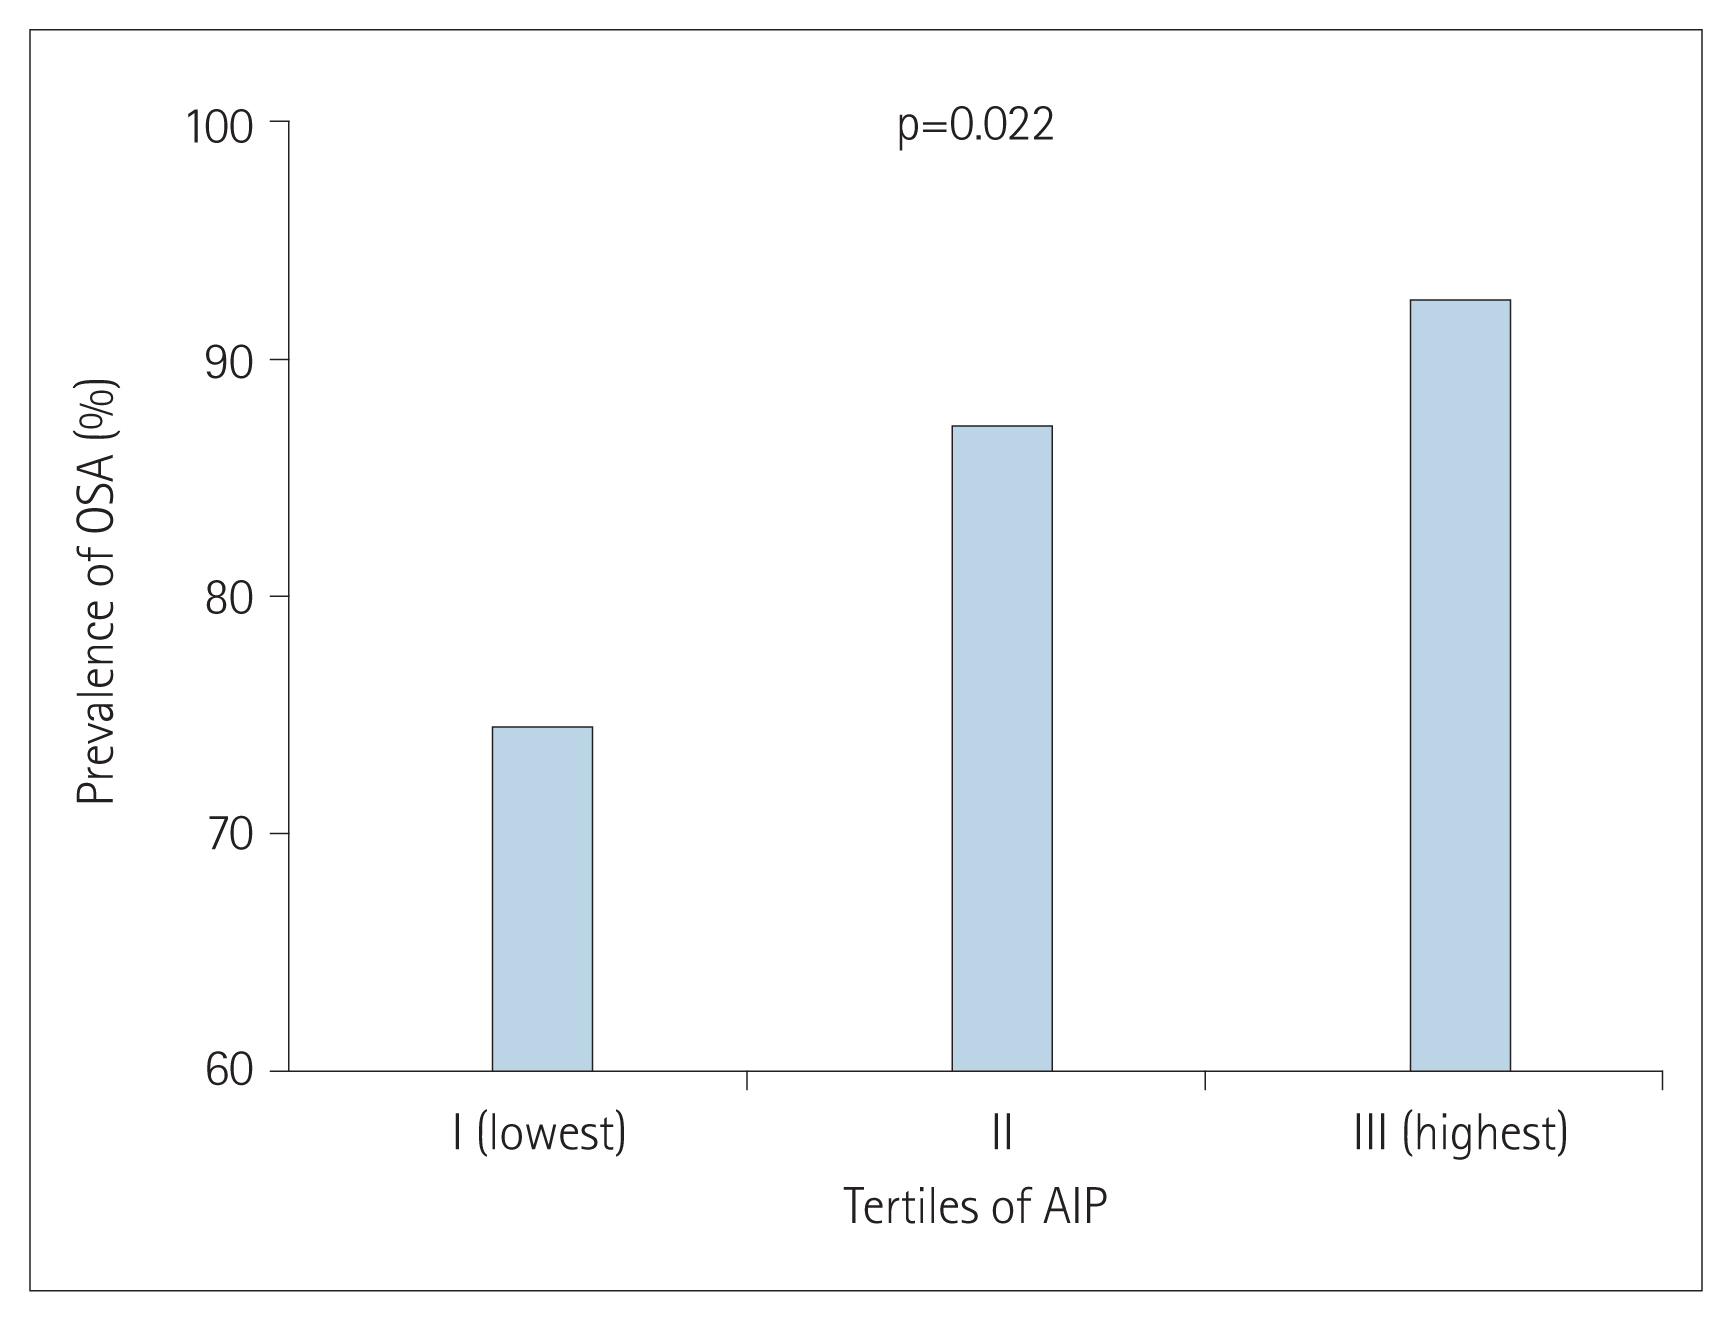
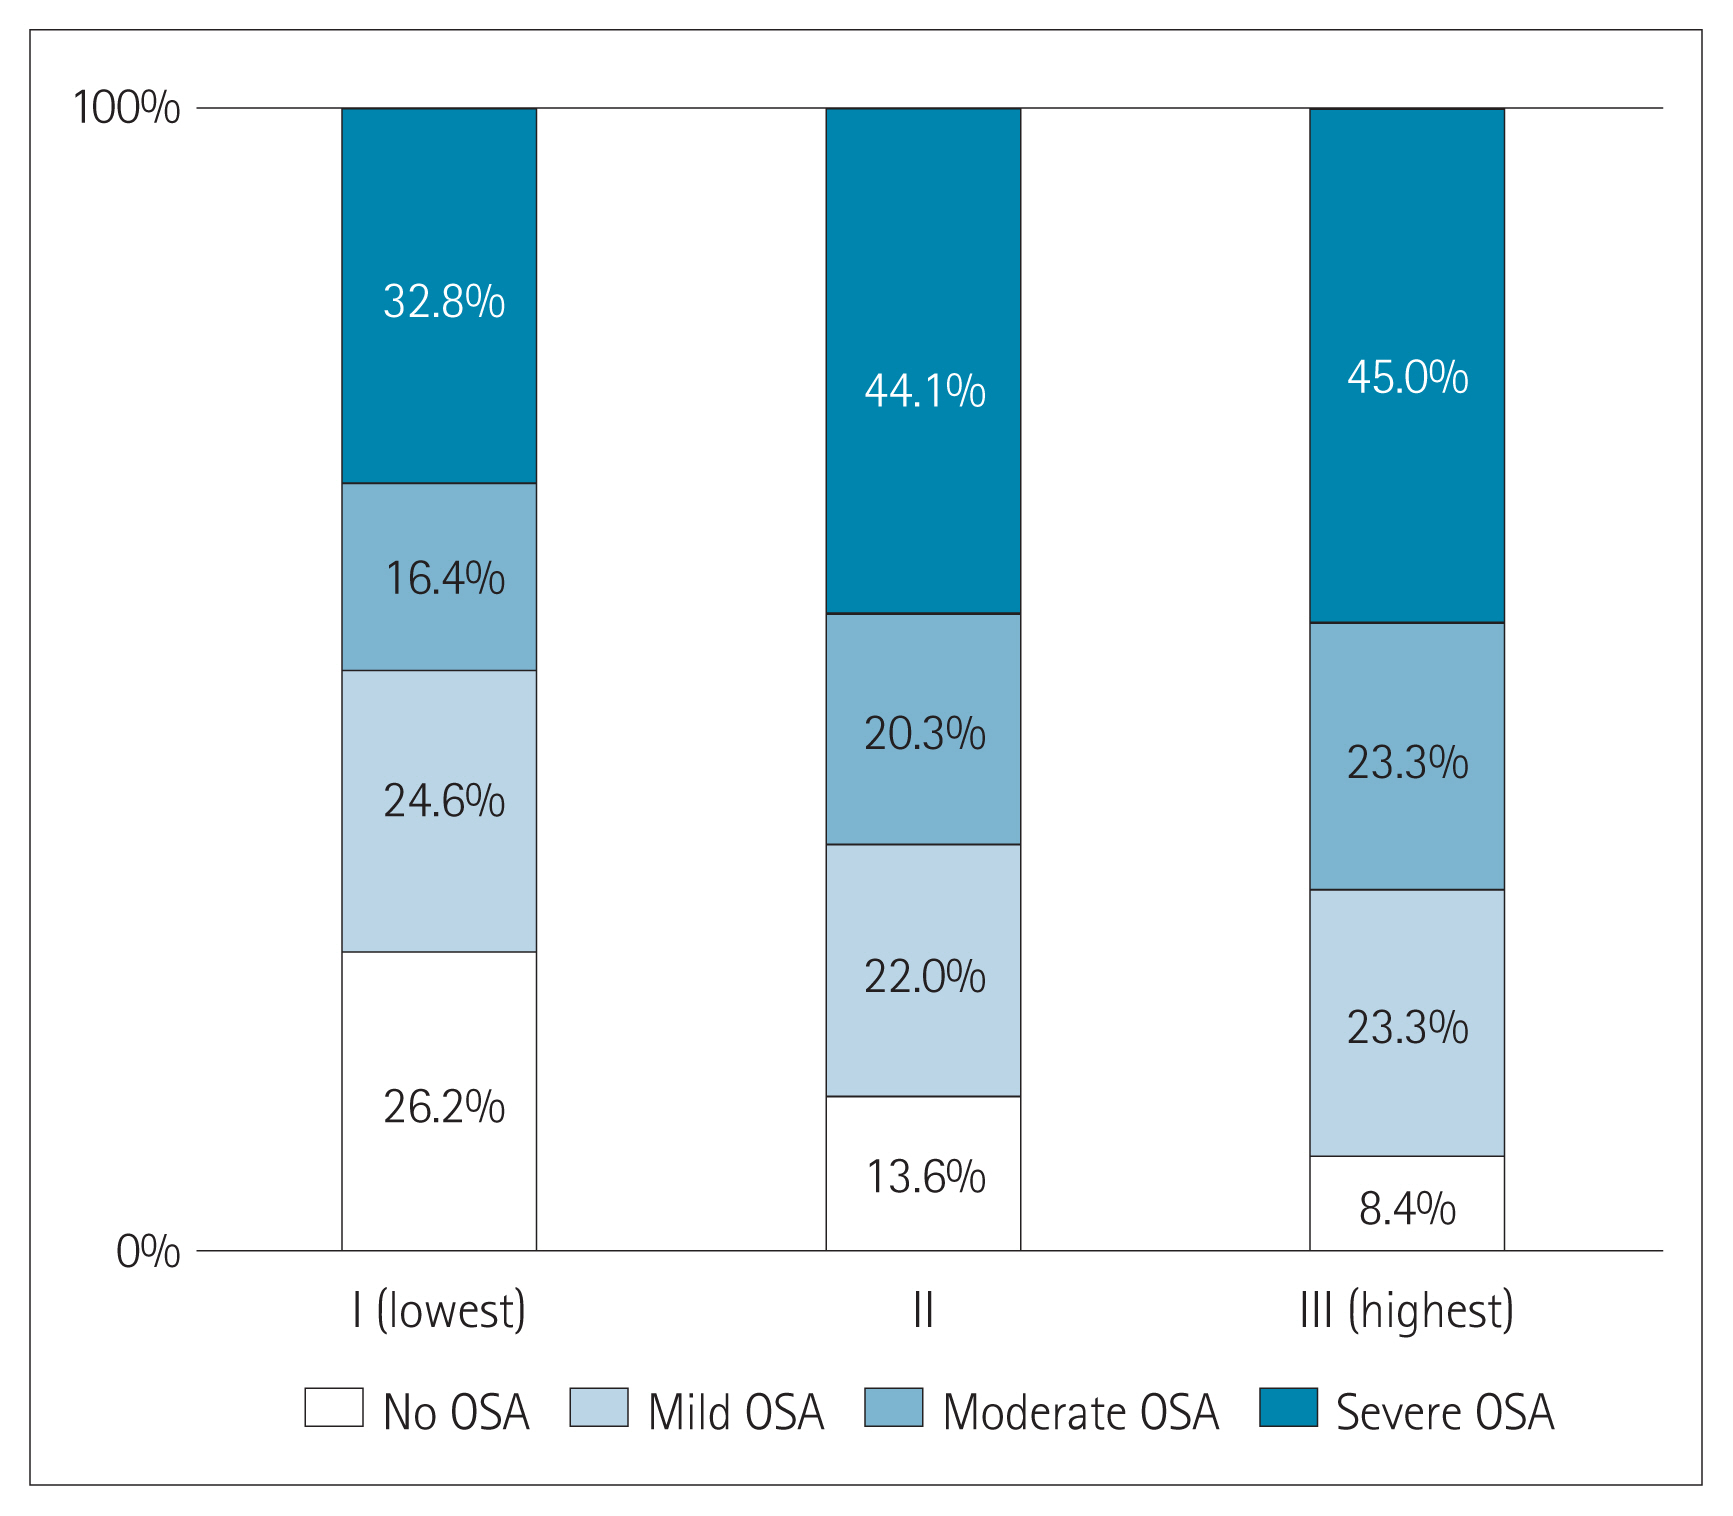
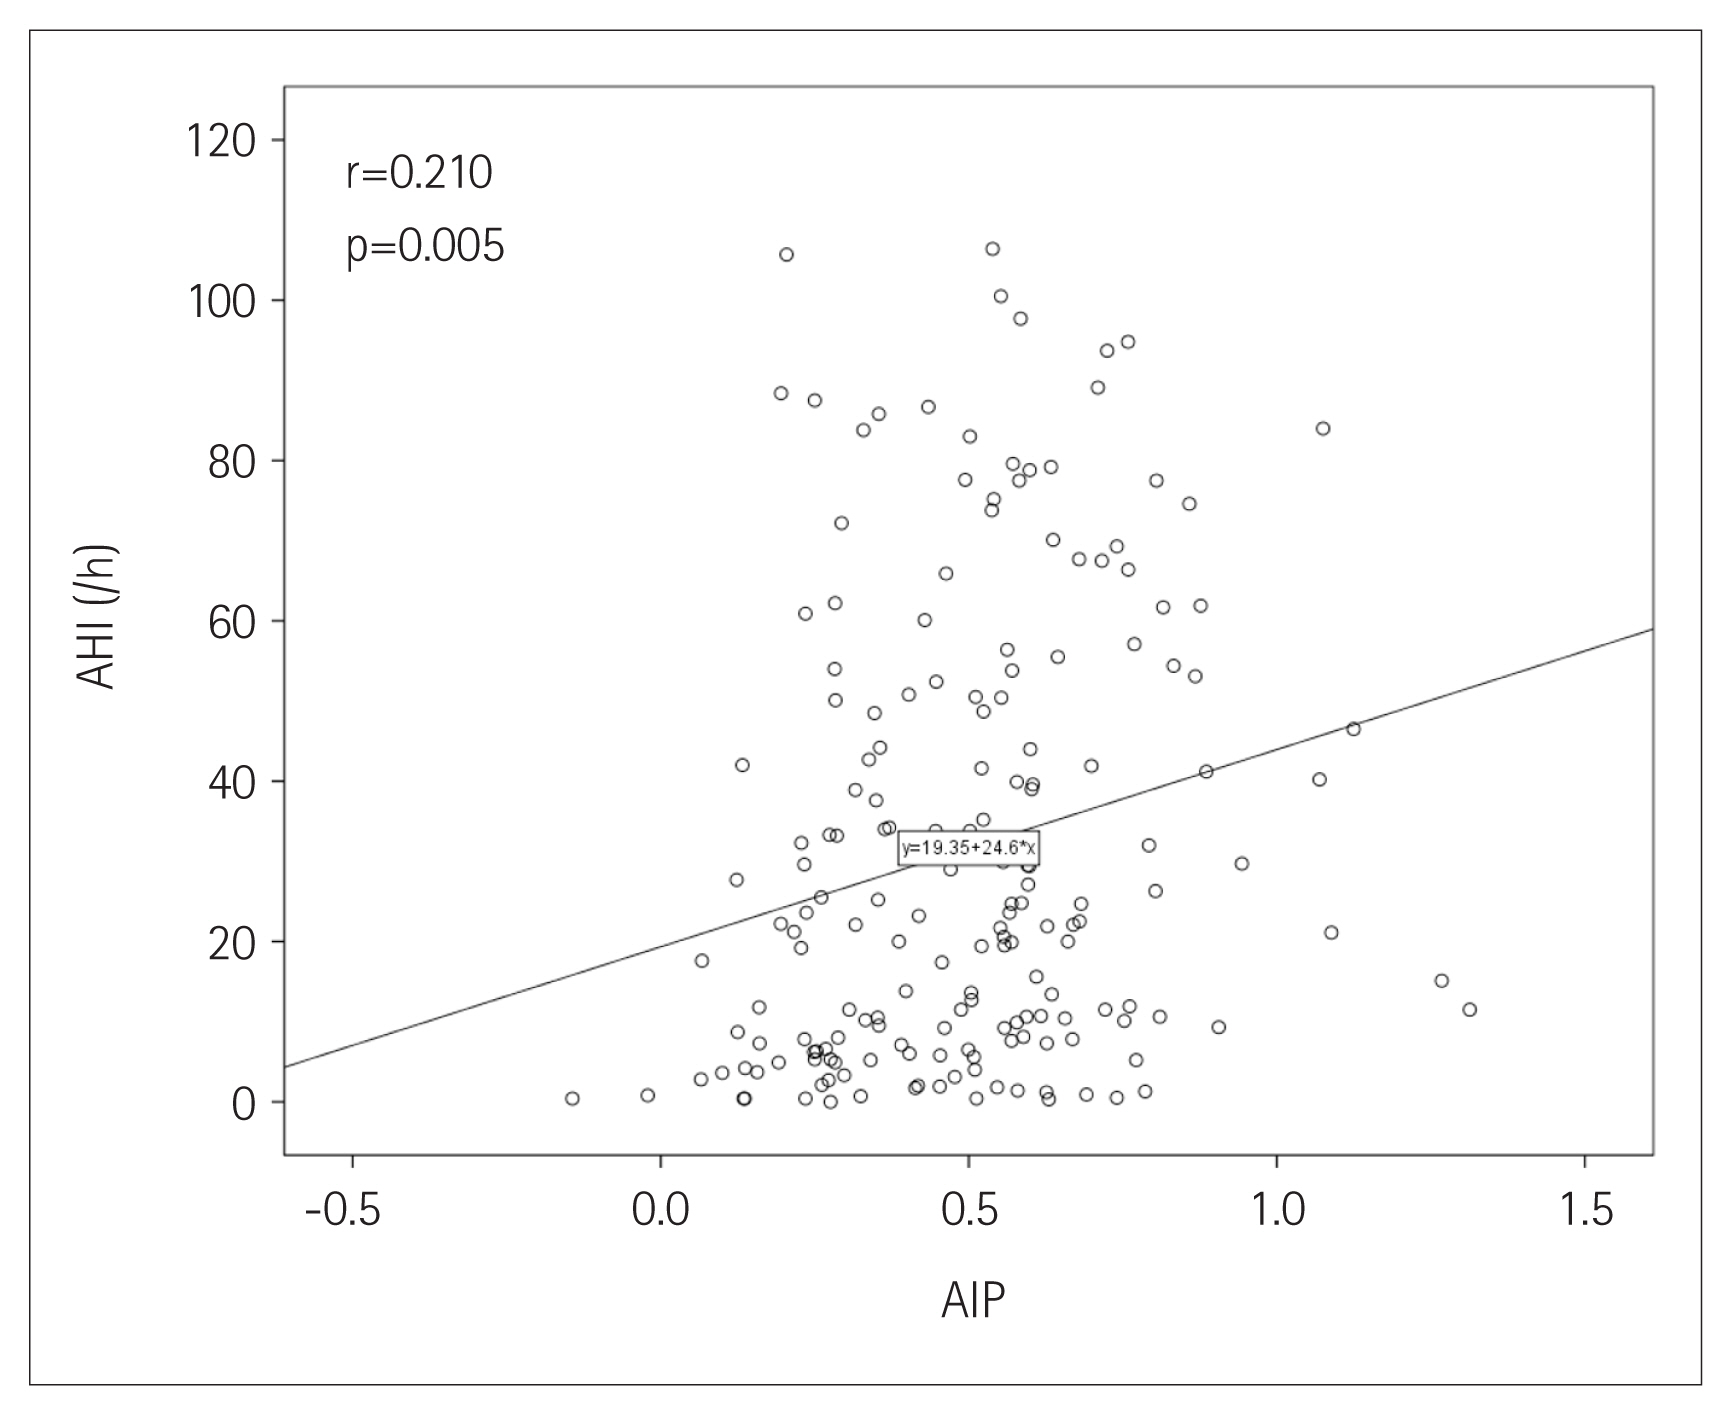
The prevalence of OSA significantly increased as AIP tertile increased [group I (lowest): 73.8%; group II: 86.4%; group III (highest): 91.7%; p=0.022] (Figure 1). The presence and severity of OSA associated with AIP tertiles are shown in Figure 2. AIP had a significant correlation with AHI in all participants (r=0.210; p=0.005) (Figure 3). Univariate linear regression analysis showed that alcohol consumption (β=11.796; p=0.006), obesity (β=23.641; p<0.001), smoking (β=14.326; p=0.001), and AIP (per 0.1-unit increase) (β= 2.460; p=0.005) had a significant association with AHI (Table 2).

Comparison of obstructive sleep apnea (OSA) prevalence according to atherogenic index of plasma (AIP) tertiles.

Composition of the presence and severity of obstructive sleep apnea (OSA) according to atherogenic index of plasma (AIP) tertiles.
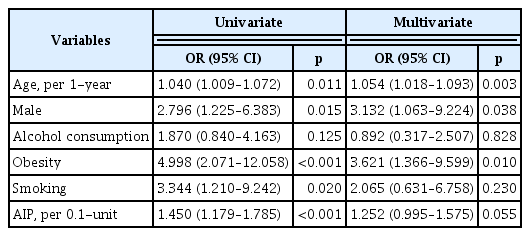
Univariate logistic regression analysis showed that age (per 1-year increase) [odds ratio (OR): 1.040; 95% confidence interval (CI): 1.009–1.072; p=0.011], male sex (OR: 2.796; 95% CI: 1.225–6.383; p=0.015), obesity (OR: 4.998; 95% CI: 2.071–12.058; p< 0.001), smoking (OR: 3.344; 95% CI: 1.210–9.242; p=0.020), and AIP (per 0.1 unit increase) (OR: 1.450; 95% CI: 1.179–1.785; p< 0.001) were associated with an increased risk of OSA. In multivariate logistic regression analysis, age (OR: 1.054; 95% CI: 1.018–1.093; p=0.003), male sex (OR: 3.132; 95% CI: 1.063–9.224; p= 0.038), and obesity (OR: 3.621; 95% CI: 1.366–9.599; p=0.010) were independently associated with an increased risk of OSA; however, AIP did not have independent association with the risk OSA (OR: 1.252; 95% CI: 0.995–1.575; p=0.055) (Table 3).
DISCUSSION
To the best of our knowledge, this is the first study to evaluate the association of AIP with the risk of OSA in Korean adults who suspected OSA. In the present study, AIP had significant relationship with AHI together with other clinical factors including alcohol consumption, obesity, and smoking. Although subjects with higher AIP levels were more prone to have the increased risk of OSA, AIP was not an independent risk factor for OSA beyond other risk factors.
AIP is inversely and significantly correlated with measures of insulin sensitivity. In addition, AIP has been reported to correlate with insulin resistance [14]. High levels of the triglycerides to HDL-C ratio have been associated with metabolic syndrome [15,16]. This might be related to the fact that hypertriglyceridemia stimulates the activity of cholesteryl ester transfer protein, which exchanges triglycerides from triglyceride-rich lipoproteins for cholesteryl esters from low- and high-density lipoproteins [17]. Triglycerides enrichment of low- and high-density lipoprotein particles renders them better substrates for lipolysis by hepatic lipase, resulting in high-density lipoprotein catabolism and elimination and the formation of more numerous, denser low-density lipoprotein particles. Thus, AIP is an important parameter which can reflect the abnormal metabolism of both lipids and glucose.
Recent study reported that the co-occurrence of hypertriglyceridemia and OSA was affected by genetics, and heritable factors might play a crucial role in dyslipidemia pathogenesis in OSA [18]. Drager et al. [19] reported that OSA was strongly associated with metabolic syndrome components, especially triglyceride and glucose levels. These studies indicated that triglyceride or triglyceride- based combined indices such as AIP and triglyceride glucose (TyG) index could be an independent predictive marker for OSA. In the present study, unlike AIP, a significant association between triglyceride and AHI was not observed (β=0.034; p=0.128). Although higher AIP levels were significantly associated with an increased risk of OSA, its significance was not observed after adjusting for other clinical risk factors. This might be related to the small sample size of this cohort registry. However, recent study which analyzed the same registry data found that TyG index was determined to be independently associated with the risk of OSA [20]. This finding means that the predictive value of triglyceride-based combined indices for OSA might be somewhat different in adults with suspected OSA.
The present study had some limitations. First, clinical factors not considered could influence the study results because of observational design. Second, the population had an unbalanced sex distribution; more males than females were referred to sleep clinics. Third, we could not control the possible effects of underlying medications on OSA. Finally, the present results should be applied with caution to the general population because only patients highly suspected of having OSA were included.
In this observational cohort study, AIP had a significant and positive correlation with AHI. Although higher AIP levels tended to be associated with the increased risk of OSA, AIP did not have an independent predictive value for OSA after adjusting for multiple clinical factors. Further prospective and longitudinal studies with large sample size should be necessary to confirm the value of the AIP for predicting OSA.
Acknowledgments
None
Notes
Conflicts of Interest
The authors have no potential conflicts of interest to disclose.
Author Contributions
Conceptualization: Hyeon Hui Kang. Data curation: Sei Won Kim. Formal analysis: Hyeon Hui Kang. Investigation: Sei Won Kim. Methodology: Hyeon Hui Kang, Sang Haak Lee. Project administration: Hyeon Hui Kang. Resources: Sei Won Kim, Sang Haak Lee. Supervision: Hyeon Hui Kang. Visualization: Hyeon Hui Kang, Sang Haak Lee. Writing—original draft: Sei Won Kim. Writing— review & editing: Hyeon Hui Kang, Sang Haak Lee.


